
Fault Tree Analysis: Symbols, Cut Sets and a Worked Example
Fault tree analysis (FTA) is a top-down, deductive method that starts from one undesired event, the top event, and works backward through AND and OR logic gates to the combinations of equipment failures, human errors and conditions that can cause it. The result shows which combinations matter most and, with failure data, how likely the top event is.
Most safety professionals meet fault trees in a training slide and never draw one. That is a pity, because the method answers a question other techniques leave open: if this serious event happens, which exact combinations of failures will have caused it, and which single failures are enough on their own?
This guide shows how to build and read a fault tree without a reliability engineering degree. You will get the standard symbols, an 8-step procedure based on the US Nuclear Regulatory Commission's Fault Tree Handbook, a fully worked tree for a power press, its minimal cut sets, a simple probability calculation, and a table for choosing between FTA, bow-tie, FMEA and an event tree.
A Press Line With a "Redundant" Light Curtain
Picture a metal stamping plant (a fictional example). A hydraulic press is guarded by a two-channel light curtain. If an operator's hand breaks the beams, the safety controller cuts the drive and the brake stops the ram. The risk assessment says: "Light curtain, dual channel. Risk tolerable."
Then a near miss. A setter clears a jammed blank during a stroke, and the ram stops later than anyone expected. Nobody is hurt. The investigation finds the brake stopping time has drifted since the last check. Someone else mentions that the light curtain is sometimes muted during die changes and not always switched back.
The plant manager asks a simple question: "We have a redundant light curtain. How can one worn brake or one forgotten mute switch defeat it?" A fault tree answers that question on one page. We will build it below.
What Is Fault Tree Analysis?
Fault tree analysis is a deductive failure analysis that focuses on one particular undesired event and identifies the combinations of lower-level events that can produce it. The NRC's Fault Tree Handbook (NUREG-0492, 1981), still the reference text, puts it in exactly those terms and adds a warning: careful choice of the top event is important to the success of the analysis.
The 2002 NASA update of the handbook (Fault Tree Handbook with Aerospace Applications) makes the method's limit explicit. A fault tree is not a model of all possible system failures. It is tailored to its top event, includes only the faults that contribute to it, and covers only the faults the analyst judges realistic.
| Term | Meaning |
|---|---|
| Top event | The single undesired event the tree explains |
| Intermediate event | A fault that happens because of lower-level causes acting through a gate |
| Basic event | A component failure or human error at the limit of resolution, not developed further |
| Gate | The logic (AND, OR) linking causes to the event above |
| Cut set | Any set of basic events that together cause the top event |
| Minimal cut set | The smallest such set: remove any one event and the top event no longer occurs |
The method is standardized internationally in IEC 61025:2006, which covers the procedure, symbols and mathematical modelling. In process safety, OSHA's Process Safety Management standard, 29 CFR 1910.119(e)(2), lists fault tree analysis among the acceptable methods for a process hazard analysis, alongside What-If, Checklist, HAZOP and FMEA.
Fault Tree Symbols and Gates
Fault trees use a small set of standard symbols. These are the ones defined in Table IV-1 of NUREG-0492.
| Symbol | Name | Meaning |
|---|---|---|
| Rectangle | Intermediate event | A fault caused by the events below it, through a gate |
| Circle | Basic event | A basic initiating fault that needs no further development |
| Diamond | Undeveloped event | Not developed further, because it is of minor consequence or information is lacking |
| House | External event | An event that is normally expected to occur (for example, "press is in production") |
| Oval | Conditioning event | A condition that applies to a gate, mainly an INHIBIT gate |
| OR gate (curved shield) | OR | The output occurs if at least one input occurs |
| AND gate (flat-bottomed shield) | AND | The output occurs only if all inputs occur |
| Hexagon | INHIBIT | The output occurs if the single input occurs while an enabling condition is present |
| Triangle | Transfer in/out | The tree continues on another page or branch |
The handbook notes that OR and AND are the two basic gate types and all other gates are special cases of them. In practice, you can build a useful workplace fault tree with only rectangles, circles, diamonds, OR and AND.
A quick way to choose the gate: ask "is any one of these causes enough on its own?" If yes, use OR. If the causes must all be present at once, as with redundant safeguards that must all fail, use AND.
How to Build a Fault Tree in 8 Steps
Building a fault tree is a disciplined drill-down: state the top event precisely, then ask "what are the immediate causes of this?" at every level until you reach failures you can no longer usefully split. The steps below follow the construction rules in NUREG-0492, Chapter V.
- Define the top event precisely. One event, stated as a fault, with what and when: "operator's hand struck by the press ram during a stroke," not "press accident." A vague top event produces a vague tree.
- Set the boundaries and assumptions. Which equipment is in scope, which operating mode (production, setting, maintenance), and which events you will treat as given. Write these down; they are part of the result.
- Identify the immediate causes. Ask what must happen directly before the top event. The handbook calls this proceeding in the "immediate cause" manner, step by step, until you reach component failures.
- Choose the gate. OR if any one cause is sufficient, AND if all are needed together.
- Write every box as a fault. Ground Rule I: state precisely what the fault is and when it occurs. "Brake fails" is weak. "Brake does not stop ram within the safety distance time" is testable.
- Complete each gate before going deeper. The Complete-the-Gate rule says all inputs to a gate should be fully defined before you develop any of them. Never connect a gate directly to another gate (the No Gate-to-Gate rule): there is always a named event in between.
- Stop at the limit of resolution. Develop each branch until you reach basic events you can act on or find data for. Mark branches you choose not to develop as undeveloped events (diamonds), and say why.
- Solve and use the tree. Find the minimal cut sets, rank them, add probabilities if you have credible data, and turn the weakest cut sets into actions.
One more rule from the handbook keeps trees honest: No Miracles. When you analyze one failure, assume every other component works normally. Do not let an unexplained lucky event save the system.
Worked Example: Power Press Fault Tree
The tree below analyzes the fictional press from the opening scenario. The top event is "operator's hand struck by the press ram during a stroke." Scope: production and jam clearing, with the press running; die setting under lockout is outside the boundary.
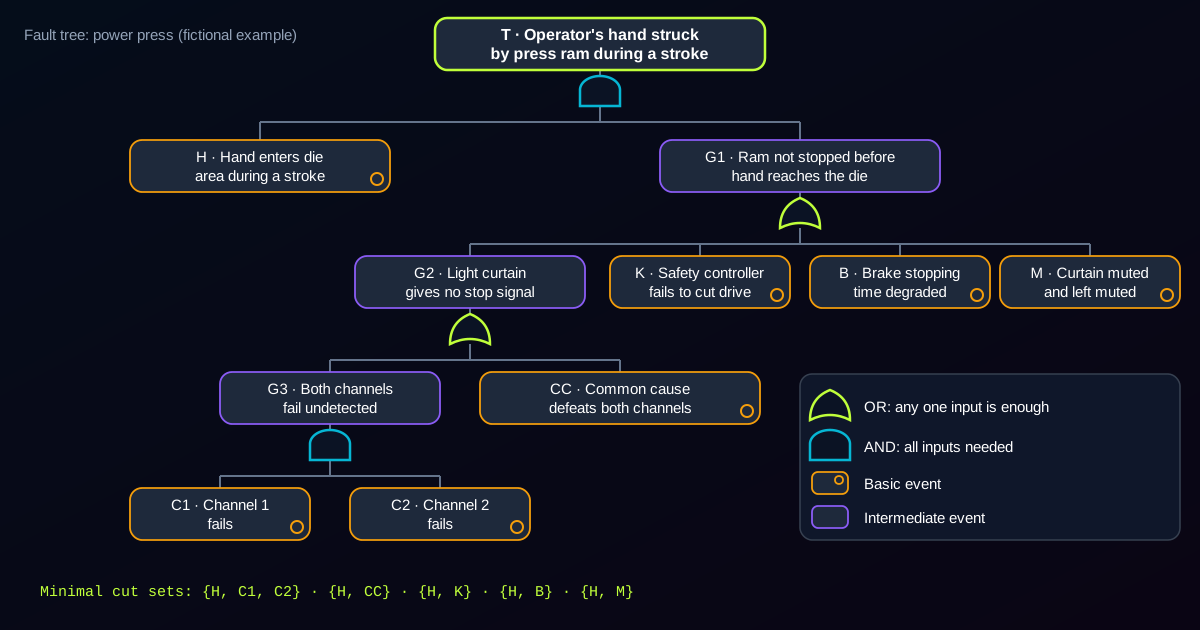
Reading from the top:
- T: Hand struck by ram (AND gate). Two things must both happen.
- H: Hand enters the die area during a stroke (basic event). This is the demand on the protection, for example reaching in to clear a jammed blank.
- G1: Ram not stopped before the hand reaches the die (OR gate). Any one of four causes is enough.
- G2: Light curtain gives no stop signal (OR gate).
- G3: Both channels fail undetected (AND gate): C1 channel 1 fails, C2 channel 2 fails.
- CC: Common cause defeats both channels (basic event), for example the curtain remounted too far from the die after a tool change, so both channels detect the hand too late.
- K: Safety controller fails to cut the ram drive (basic event).
- B: Brake stopping time degraded beyond the safety distance (basic event).
- M: Light curtain muted and left muted (basic event), a human and procedural failure.
- G2: Light curtain gives no stop signal (OR gate).
Writing the tree as Boolean logic gives:
T = H · (C1·C2 + CC + K + B + M)
Notice what the tree has already done. The risk assessment said "dual channel," but the dual channels sit under one AND gate, at the bottom of one of four OR branches. The other three branches have no redundancy at all.
Minimal Cut Sets: Reading What the Tree Tells You
A minimal cut set is the smallest combination of basic events which, if they all occur, causes the top event (NUREG-0492, VII-15). Every fault tree has a finite number of them, and together they are the tree's full answer. Expanding the expression above gives five minimal cut sets:
| # | Minimal cut set | Order | What it means |
|---|---|---|---|
| 1 | {H, C1, C2} | 3 | Both curtain channels fail while a hand is in the die area |
| 2 | {H, CC} | 2 | One common cause defeats the curtain while a hand is in |
| 3 | {H, K} | 2 | Controller fails while a hand is in |
| 4 | {H, B} | 2 | Worn brake while a hand is in |
| 5 | {H, M} | 2 | Curtain left muted while a hand is in |
Three rules turn this table into decisions:
- Count the events in each cut set. A one-event cut set is a single point of failure for the whole system. A two-event cut set means one failure plus one demand. Higher-order sets mean real redundancy.
- Look for events that appear in every cut set. Here H, the hand entering the die area, is in all five. Remove the demand and every path to the top event closes. That is the hierarchy of controls seen through logic: eliminating the reason to reach in beats any improvement to the protection.
- Treat the protection's single points honestly. Given the demand, CC, K, B and M are each enough on their own. Only cut set 1 benefits from the second channel.
Even without a single number, the plant manager now has an answer: the "redundant" light curtain protects against one failure mode out of five.
Quantifying the Tree: A Simple Probability Example
You can quantify a fault tree by giving each basic event a probability and combining them through the gates: multiply probabilities at an AND gate (for independent events) and, for rare events, add the minimal cut set probabilities at the top. These two rules come from NUREG-0492 (VII-9 and XI-15 for AND; XI-19 for the sum).
The numbers below are invented for illustration, not failure data. For a real analysis use your own test and maintenance records or a recognized failure-rate database.
| Event | Illustrative value | Meaning |
|---|---|---|
| H | 20 per year | Times a hand enters the die area during a stroke |
| C1, C2 | 5 × 10⁻³ each | Probability each channel is failed when needed |
| CC | 5 × 10⁻⁴ | Probability a common cause defeats both channels |
| K | 2 × 10⁻⁴ | Probability the controller fails to cut the drive |
| B | 5 × 10⁻⁴ | Probability the brake is too slow when needed |
| M | 1 × 10⁻³ | Probability the curtain is muted at the moment of demand |
Step 1: AND gate G3. C1 × C2 = 5 × 10⁻³ × 5 × 10⁻³ = 2.5 × 10⁻⁵.
Step 2: probability the protection fails on demand (G1). Using the rare event approximation, add the cut set terms: 2.5 × 10⁻⁵ + 5 × 10⁻⁴ + 2 × 10⁻⁴ + 5 × 10⁻⁴ + 1 × 10⁻³ = 2.225 × 10⁻³. The exact value, 1 − (1 − 2.5 × 10⁻⁵)(1 − 5 × 10⁻⁴)…(1 − 1 × 10⁻³), is about 2.223 × 10⁻³. The handbook notes that the approximation generally agrees within 10% when the result is below 0.1, and errs on the conservative side; here the difference is about 0.1%.
Step 3: frequency of the top event. Multiply the demand rate by the probability the protection fails: 20 × 2.225 × 10⁻³ ≈ 0.045 per year, roughly once every 22 years for this one press.
Step 4: rank the contributors. Each cut set's share of the 2.225 × 10⁻³:
| Cut set | Share |
|---|---|
| {H, M} curtain left muted | 45% |
| {H, CC} common cause | 22% |
| {H, B} worn brake | 22% |
| {H, K} controller | 9% |
| {H, C1, C2} both channels | 1% |
The redundant channels contribute 1% of the risk. A procedure problem contributes 45%.
Step 5: test the controls. Suppose the plant adds a keyed muting switch that resets automatically, a monthly brake stopping-time check, and a safety-distance check after every die change. If those cut M, B and CC to 1 × 10⁻⁴ each (again, illustrative), the sum falls to 5.25 × 10⁻⁴ and the frequency to about 0.011 per year, roughly once every 95 years. If engineering also fixes the feed so that hand entries fall from 20 to 5 a year, the frequency drops to about 0.0026 per year, once every 380 years or so.
The common-cause trap
Without CC, the two-channel branch contributes only 2.5 × 10⁻⁵. Adding a single shared cause raises that branch to 5.25 × 10⁻⁴, about 21 times higher. NUREG-0492 (XI-18) warns about exactly this: the independence assumption is an optimal condition, and true values for double and higher cut sets may be much higher than calculated because failures are rarely fully independent. Whenever an AND gate represents "redundancy," ask what could defeat both inputs at once: the same power supply, the same maintenance technician, the same dirty lens, the same wrong setting.
FTA vs Bow-Tie vs FMEA vs Event Tree
Fault tree analysis is the right choice when you need to understand, in depth, how one specific serious event can happen and which combinations of failures lead to it. Other methods answer different questions.
| Question | Fault tree (FTA) | Bow-tie | FMEA | Event tree |
|---|---|---|---|---|
| Direction | Top-down from one event to its causes | Causes on the left, consequences on the right | Bottom-up from each component or step | Forward from one initiating event to outcomes |
| Logic | AND/OR gates; combinations of failures | Barriers on each threat and consequence line | One failure mode at a time | Success/failure branches of each safeguard |
| Best at | Redundancy, common cause, single points of failure | Communicating barriers to managers and crews | Covering every component of a machine or line | Showing how an event escalates |
| Quantification | Natural, from basic-event data | Usually qualitative | RPN or action priority | Natural, branch probabilities |
| Main weakness | Covers only the top event you chose | Hides combinations of failures | Misses combinations of failures | Needs a defined initiating event |
The methods combine well. A What-If analysis or HAZOP finds the scenarios; FMEA covers the machine component by component; a fault tree takes the one or two scenarios with the worst consequences and examines their logic. A bow-tie combines the logic of a fault tree on its left side with an event tree on its right, so a completed fault tree is a good input for the threat side of a bow-tie.
FTA is also used after the fact. When an incident involves several failures at once, a fault tree helps an investigation show which combination occurred and which others were possible. For the broader investigation process, see our guide to root cause analysis.
Common Fault Tree Mistakes
1. A vague top event
"Press accident" or "explosion" cannot be analyzed. Without a precise what and when, every branch grows without limit and the team argues about scope instead of causes. Write the top event so that anyone could tell whether it happened.
2. Using OR where AND belongs (and the reverse)
Putting redundant safeguards under an OR gate makes the system look far weaker than it is. Putting independent causes under an AND gate makes it look far stronger. Check every gate by asking: "Is any single input enough?"
3. Gate connected directly to gate
Skipping the named event between two gates hides your reasoning. The NUREG No Gate-to-Gate rule exists because a reviewer cannot check logic they cannot read.
4. Assuming redundancy means independence
Two channels, two pumps or two operators fed by the same cause are not two barriers. Add common-cause events explicitly, as CC in the example, or the tree will overstate your protection.
5. Leaving out human and procedural failures
A tree with only hardware failures misses events like M, the muted curtain, which in the example carries the largest share of the risk. Maintenance, bypassing, setting errors and permit failures belong in the tree as basic events.
6. Trusting the number more than the logic
Quantified results are only as good as the failure data and the assumptions. A top-event frequency calculated from guesses is still a guess. Use the numbers to rank and compare options, and let the cut sets drive the decisions.
7. Building it alone
A fault tree drawn by one analyst reflects one person's view of the system. Operators, setters and maintenance technicians know how the press is really used, including the mute switch nobody mentions in the risk assessment.
How FindRisk Supports Risk Analysis
A fault tree tells you which failures matter. Turning that into fieldwork means inspecting the controls that sit in the weakest cut sets, and recording what you find. FindRisk's AI checklist generator can build an inspection checklist for those specific controls, such as the light curtain mounting distance, the muting switch and the brake check records.
During the walkdown, you can mark hazards directly on photos and use the AI analysis to flag related issues. Score the hazards you find with the built-in Fine-Kinney risk assessment, then produce a professional report in seconds, on iOS or Android, to support the actions your fault tree identified.
Frequently Asked Questions
Is fault tree analysis qualitative or quantitative?
It can be either. A qualitative fault tree identifies the minimal cut sets, single points of failure and common causes without any numbers, and that alone often justifies the work. A quantitative fault tree adds probabilities or frequencies to the basic events and combines them through the gates to estimate how likely the top event is and which cut sets contribute most.
What is the difference between FTA and FMEA?
FTA works top-down from one undesired event and finds the combinations of failures that cause it. FMEA works bottom-up, taking each component or process step and asking how it can fail and with what effect. FMEA is better at covering every part of a system; FTA is better at showing how several failures combine, including redundancy and common causes. Many teams use FMEA first and FTA for the worst scenarios.
What is the difference between a fault tree and an event tree?
A fault tree looks backward from an event to its causes using AND and OR gates. An event tree looks forward from an initiating event and branches on whether each safeguard works or fails, showing the possible outcomes. They are complementary: the fault tree explains how the event happens, and the event tree shows how it can escalate. A bow-tie diagram combines both views.
Can fault tree analysis be used for incident investigation?
Yes. After an incident, a fault tree helps the team test which combination of failures actually occurred and shows other combinations that could have led to the same event. It is most useful when several technical and human failures overlap. For simpler incidents, the 5 Whys or a fishbone diagram is usually enough, and FTA can be added for the high-consequence branch.
Where do the failure probabilities in a fault tree come from?
From your own records first: test results, inspection findings, maintenance history, downtime logs and how often a task creates a demand on a safeguard. Recognized industry failure-rate databases can fill gaps. When data is weak, use ranges and test whether the ranking of cut sets changes. If the ranking holds across reasonable values, the decision is robust even if the absolute number is uncertain.
Is fault tree analysis mandatory?
Generally not; it is one option among several. In process safety, OSHA 29 CFR 1910.119(e)(2) lists fault tree analysis as one of the methods an employer may use for a process hazard analysis, next to What-If, HAZOP and FMEA, or an appropriate equivalent. Outside such rules, FTA is a choice, and the right one where a serious event depends on several failures occurring together.
Conclusion
Fault tree analysis turns one serious event into a logic diagram you can check. Its real output is the list of minimal cut sets: which single failures are enough, which combinations need to coincide, and which events, like the demand itself, appear everywhere. In the press example, that list showed that a "redundant" light curtain protected against one failure path in five, and that a mute switch mattered more than the second channel.
You do not need software or perfect data to start. Define the top event precisely, build the tree with a team that knows the equipment, follow the construction rules, and read the cut sets before you calculate anything. Add numbers when they help you rank options, and watch for common causes behind every AND gate.
When the tree has shown you where the weak points are, check those controls in the field. Download FindRisk to build a checklist for the controls your fault tree depends on, record what you find with photos, and produce the report in seconds.
Try FindRisk
Ready to modernize your safety workflow?
Conduct AI-powered risk assessments, generate reports instantly, and keep your team safe — anywhere, anytime.