

Layer of Protection Analysis (LOPA): Steps and Worked Example
Layer of protection analysis (LOPA) is a semi-quantitative risk assessment method that takes one hazard scenario, usually from a HAZOP, and estimates how often it will reach its consequence. You multiply the initiating event frequency by the probability that each independent protection layer fails, compare the result with a tolerable frequency, and close any gap, often with a safety instrumented function of a stated SIL.
A HAZOP team is good at finding what can go wrong. It is less good at answering the next question: are the safeguards we listed actually enough? Three alarms and a procedure can look reassuring in a worksheet and still leave a severe scenario far more likely than anyone would accept.
LOPA answers that question with order-of-magnitude numbers. This guide gives you the equation, the tests a safeguard must pass before it earns credit, a seven-step method, a fully worked example that rejects two of the listed safeguards, the link from LOPA to SIL, and the mistakes the UK regulator found when it reviewed real LOPA studies.
One HAZOP Line That Needs More Than a Judgment
Picture a paint plant with a toluene day tank (a fictional example we will use throughout). A transfer pump fills the tank from bulk storage. The basic process control system (BPCS) reads a level transmitter and stops the pump at the set level.
The HAZOP worksheet has a line for the deviation "more level". The cause is a failure of the level control loop. The consequence is an overfill: toluene runs down the tank into the bund, the vapor finds an ignition source and a pool fire starts. An operator working in the tank area could be killed.
The safeguards column lists four items: a high-level alarm, a separate high-high level switch, the bund and the operating procedure. The team's risk ranking says "medium". Someone asks whether that is good enough for a fatality scenario, and nobody can answer with confidence. That is the moment to take the scenario to LOPA. We will run this exact case later in the guide.
What Is Layer of Protection Analysis?
LOPA is a simplified form of quantitative risk assessment that works on one cause-consequence pair at a time. The method was set out by the Center for Chemical Process Safety (CCPS) in its 2001 book Layer of Protection Analysis: Simplified Process Risk Assessment. It is widely used to check whether the safeguards on a scenario are sufficient and to set the target safety integrity level (SIL) of safety instrumented functions.
In a 2009 IChemE paper on a new COMAH plant, J. Mullins describes LOPA as "intended primarily as an engineering substantiation tool", a way of determining whether sufficient, robust safeguards are in place (Mullins, Hazards XXI, 2009). The same paper notes that IEC 61508 and IEC 61511 require a risk assessment to set a target SIL for each safety instrumented function, and that for more complex or higher hazards the standards point to LOPA or fault tree analysis rather than a simple risk graph.
| Feature | What it means in practice |
|---|---|
| Unit of analysis | One scenario: one initiating event leading to one consequence |
| Type | Semi-quantitative: numbers are order-of-magnitude estimates, not precise reliability data |
| Input | A HAZOP, What-If or bow-tie scenario with a severe consequence |
| Key test | Only independent protection layers (IPLs) earn credit |
| Output | Mitigated frequency vs a tolerable target, the gap, and the required SIL of any new safety instrumented function |
| Other names | Layers of protection analysis, LOPA study, LOPA SIL assessment |
LOPA does not replace HAZOP. HAZOP finds the scenarios; LOPA tests the few that matter most. If you need the scenario-finding step, start with our HAZOP study guide.
The LOPA Equation
The core of LOPA is one multiplication. For a scenario with one initiating event:
Mitigated event frequency = initiating event frequency × conditional modifiers × PFD of each IPL
| Term | Meaning | Unit |
|---|---|---|
| Initiating event frequency (IEF) | How often the cause happens, for example a control loop failure | per year |
| Enabling condition | A condition that must be present for the cause to lead anywhere, for example the tank being filled | probability (0–1) |
| Conditional modifier (CM) | A probability between the event and the harm you assess, for example ignition, or a person being present | probability (0–1) |
| Probability of failure on demand (PFD) | The chance that a protection layer does not work when it is needed | probability (0–1) |
| Risk reduction factor (RRF) | 1 ÷ PFD. A layer with a PFD of 0.01 reduces the frequency 100 times | dimensionless |
Two ratios follow from it:
- Gap = mitigated frequency ÷ tolerable frequency. A gap above 1 means more protection is needed.
- Required PFD of a new layer = tolerable frequency ÷ mitigated frequency before that layer. Mullins (2009) uses this to set the SIL of a safety instrumented function.
Because every value is an order-of-magnitude estimate, it makes sense to round the result to one significant figure. A result of 6 × 10⁻⁶ per year means "about once in a hundred thousand to a million years", not a precise prediction.
What Counts as an Independent Protection Layer?
An independent protection layer (IPL) is a safeguard that can stop the scenario on its own, regardless of the initiating event and of every other layer credited. Mullins (2009) gives the three tests a safeguard must pass before it is credited: independence, effectiveness and auditability, the last meaning that you can show its effectiveness is maintained, through testing and inspection.
Every IPL is a safeguard, but not every safeguard is an IPL. The HSE-commissioned review of real LOPA studies (Health and Safety Laboratory, A review of Layers of Protection Analysis (LOPA) analyses of overfill of fuel storage tanks, HSE Research Report RR716, 2009) found that many studies failed to show independence: the same level device or PLC was often common to more than one layer, and the operators who run the process were also the ones expected to respond to the alarms.
Two constraints from BS EN 61511, both quoted in RR716, shape almost every LOPA:
- A BPCS that does not conform to IEC 61511 cannot be assumed to fail dangerously less often than 10⁻⁵ per hour. That is about 0.09 per year (10⁻⁵ × 8,760 hours), usually rounded to 0.1 per year.
- A protection layer that is not SIL rated cannot be claimed with a PFD below 0.1, even if a reliability study suggests a lower number.
The table below is our guidance, built from the three tests and the RR716 findings. Values for specific equipment (relief valves, check valves and so on) should come from your company's LOPA data source, which must be stated in the study.
| Safeguard | Credit as an IPL? | Why |
|---|---|---|
| The BPCS control loop whose failure is the initiating event | No | It is the cause, so it cannot also protect against it |
| An alarm from the same transmitter as the failed control loop | No | Shared sensor: when the transmitter fails, the alarm fails too |
| An independent alarm (own sensor, not through the failed BPCS) with a trained operator, a written response and enough time to act | Yes, PFD no lower than 0.1 | Non-SIL rated layer; the operator response must be justified, not assumed |
| Two alarms answered by the same operator | Credit one at most | RR716 treats the same operator as a common cause failure |
| A safety instrumented function designed, verified and proof tested to IEC 61511 | Yes, at the PFD its SIL verification supports | The only route to a PFD below 0.1 for an instrumented layer |
| A pressure relief device sized for this exact scenario and inspected | Often yes, using your data source's value | Must be sized for the case and its testing recorded |
| A bund (dike) | Only if it prevents the consequence assessed | A bund contains liquid but does not stop a pool fire inside it |
| Training, procedures, PPE, warning signs | No PFD on their own | They support other layers; they do not stop the scenario independently |
| Fire and gas detection, deluge, emergency response | Rarely, and only with analysis | They act after the event starts and may not protect the person exposed at ignition |
How to Do a LOPA in 7 Steps
LOPA works best as a short, focused session after the HAZOP, with the HAZOP chair or a process safety engineer, an operations representative who knows how the plant is really run, an instrument engineer and someone who knows the data source.
Step 1: Select the scenario
Take one cause and one consequence from the HAZOP worksheet. If a deviation has three causes, that is three LOPA scenarios. The common CCPS calculation sheet covers one initiating event per sheet (Chambers, McCulloch and Li, Hazards 34, 2024).
Step 2: State the consequence and the tolerable frequency
Write the consequence in plain words (for example "one operator fatality from a pool fire") and pick the target that matches it from your company's risk criteria. RR716 found that several studies did not clearly state their risk criteria: a risk of what, from what, to whom.
Step 3: Estimate the initiating event frequency
Use a source you can name. Do not break a cause into small "independent" pieces just to lower its frequency: RR716 warns that this could lead to unrealistically low initiating event frequencies. Remember the BPCS floor of 10⁻⁵ per hour.
Step 4: Apply enabling conditions and conditional modifiers
Typical modifiers are the probability of ignition, the probability that someone is in the affected area and the probability that exposure is fatal. Justify each one. Never count the same fact twice: RR716 says plainly that "low manning levels cannot be counted more than once".
Step 5: Test every listed safeguard against the IPL criteria
Go through the HAZOP safeguards one by one and ask the three questions: is it independent of the cause and of the other credited layers, would it actually stop this scenario in the time available, and can you prove it works through testing records? Assign a PFD only to those that pass.
Step 6: Calculate and compare
Multiply, round, and compare the mitigated frequency with the target. Record the gap.
Step 7: Close the gap, test the sensitivity and record it
First look for an inherent change (a smaller tank, a different fill method), then for a new IPL, and only then for a safety instrumented function with a required SIL. Rerun the calculation with the most uncertain input changed. RR716 found a sensitivity study in only one of the studies it reviewed, and calls it good practice. Put every action through your management of change process so the credited layers stay in place.
Worked Example: LOPA for a Solvent Day Tank Overfill
This is the toluene day tank from the start of the guide. The plant, tags and all numbers except the two BS EN 61511 constraints are our own illustration, chosen to show the method. They are not data for a real design.
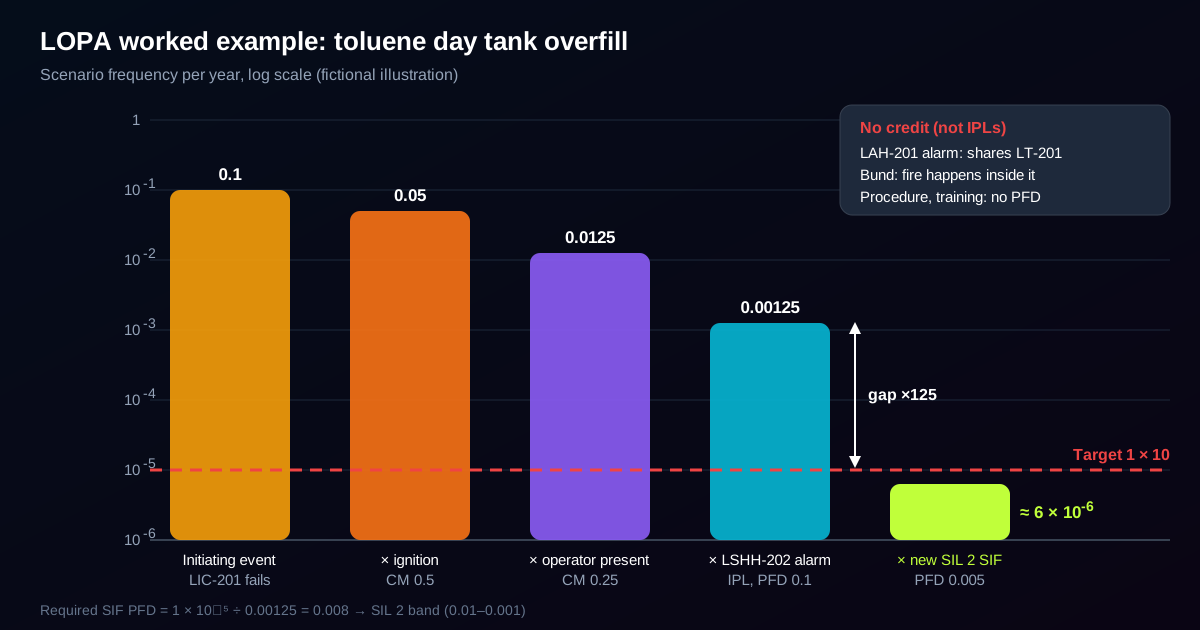
The scenario
| Field | Entry |
|---|---|
| HAZOP reference | Node 2, day tank TK-201, deviation "more level" |
| Initiating event | Level control loop LIC-201 (BPCS) fails, transfer pump keeps running |
| Consequence | Overfill into the bund, toluene vapor ignites, pool fire; one operator fatality possible |
| Tolerable frequency | 1 × 10⁻⁵ per year for a single-fatality scenario (the fictional company's criterion) |
Step-by-step numbers
| Line | Item | Value | Basis |
|---|---|---|---|
| 1 | Initiating event: LIC-201 loop failure | 0.1 per year | BPCS cannot be claimed better than 10⁻⁵ per hour ≈ 0.1 per year |
| 2 | CM: probability of ignition | 0.5 | Team estimate: tank area is zoned but has a road and pump motors nearby |
| 3 | CM: probability an operator is in the area | 0.25 | Team estimate from shift patterns; used only once |
| 4 | Safeguard: high-level alarm LAH-201 | No credit | Same transmitter LT-201 as the failed control loop |
| 5 | Safeguard: independent high-high switch LSHH-202, hardwired alarm, operator stops the pump | PFD 0.1 | Own sensor, alarm not through the BPCS, written response, about 30 minutes between alarm and overflow, switch proof tested every 6 months |
| 6 | Safeguard: bund | No credit | Keeps the toluene on site but the pool fire happens inside the bund |
| 7 | Safeguard: operating procedure and training | No credit | Supports line 5; not an independent layer |
| 8 | Mitigated frequency (1 × 2 × 3 × 5) | 1.25 × 10⁻³ per year | 0.1 × 0.5 × 0.25 × 0.1 |
| 9 | Gap to target | 125 | 1.25 × 10⁻³ ÷ 1 × 10⁻⁵ |
The listed safeguards leave the scenario about 125 times more likely than the company accepts. The HAZOP's "medium" ranking was hiding a large gap.
Closing the gap
The team first asks whether an inherent change is possible. A smaller transfer pump would give the operator more time but would not remove the scenario, so the team adds a new layer: a safety instrumented function (SIF) with its own level transmitter LT-203 and its own logic solver, which trips the pump and closes shut-off valve XV-203 on high-high level.
- Required PFD of the SIF = 1 × 10⁻⁵ ÷ 1.25 × 10⁻³ = 0.008, a risk reduction factor of at least 125.
- A PFD of 0.008 sits in the SIL 2 band (0.01 to 0.001).
- The instrument engineer designs the SIF to a verified PFD of 0.005. The new mitigated frequency is 1.25 × 10⁻³ × 0.005 ≈ 6 × 10⁻⁶ per year, below the target.
Sensitivity: what if ignition is certain?
The ignition probability of 0.5 is the weakest number in the sheet. If the team sets it to 1.0, the frequency before the SIF doubles to 2.5 × 10⁻³ per year and the required PFD becomes 1 × 10⁻⁵ ÷ 2.5 × 10⁻³ = 0.004.
The SIF is still SIL 2, but the planned design (PFD 0.005) no longer meets the target: 2.5 × 10⁻³ × 0.005 ≈ 1.3 × 10⁻⁵ per year. The team either specifies the SIF to a PFD of 0.004 or better, or removes ignition sources from the tank area so that the 0.5 can be defended. Without the sensitivity check, nobody would have seen that the design had almost no margin.
What the wrong credit would have done
Suppose the team had credited the high-level alarm LAH-201 with a PFD of 0.1, as many studies do. The mitigated frequency would drop to 1.25 × 10⁻⁴ per year, the required PFD of the SIF would become 0.08 and the SIF would be specified as SIL 1 instead of SIL 2. One wrongly credited alarm sharing a transmitter with the cause takes a full order of magnitude out of the protection.
How LOPA Sets the SIL of a Safety Instrumented Function
The SIL of a safety instrumented function operating in low demand mode is a band of PFD values. LOPA gives you the required PFD; the band it falls in is the target SIL.
| SIL | PFD (low demand) | Risk reduction factor |
|---|---|---|
| SIL 1 | 0.1 to 0.01 | 10 to 100 |
| SIL 2 | 0.01 to 0.001 | 100 to 1,000 |
| SIL 3 | 0.001 to 0.0001 | 1,000 to 10,000 |
| SIL 4 | 0.0001 to 0.00001 | 10,000 to 100,000 |
PFD bands from Mullins (2009), Table 1; the risk reduction factor is 1 ÷ PFD.
Three practical points:
- The LOPA sets the target; the design must prove it. A SIL 2 target is met only when the SIF's architecture, component data and proof-test interval are verified to deliver a PFD inside the band, under IEC 61511.
- Carry the required PFD, not just the SIL. In the example, "SIL 2" covers 0.008 and 0.004 equally, but the design that meets one fails the other.
- A SIL 3 or SIL 4 result is a warning. It usually means the scenario relies too heavily on instruments. Look again for inherent changes before you specify one. Chambers et al. (2024) name over-reliance on controls instead of inherent safety as a limitation of LOPA and bow-tie work.
Choosing a Tolerable Frequency Target
LOPA compares your result with a target, so the target matters as much as the arithmetic. Most companies set targets by consequence category (for example single fatality, multiple fatalities, serious injury) inside a national framework.
In the UK, the Tolerability of Risk framework comes from HSE. Its 1992 document The tolerability of risk from nuclear power stations gives the reference points still used today (HSE, 1992, paras 169–175):
| Reference point | Annual risk of death |
|---|---|
| Just about tolerable for a substantial category of workers | 1 in 1,000 |
| Maximum tolerable for a member of the public from one large-scale hazardous plant | 1 in 10,000 |
| Broadly acceptable | 1 in a million |
These describe the overall risk to an individual, not the risk from one scenario. A single LOPA scenario is only one contributor, so a per-scenario target is usually set tighter than the individual risk limit. Between the tolerable and broadly acceptable levels, the risk must still be reduced as low as reasonably practicable. Our ALARP guide explains how to show that.
What RR716 found when it looked at the targets in real studies:
- Many used an individual risk target of 1 × 10⁻⁶ per year.
- Two used 1 × 10⁻⁵ per year or higher for a risk to more than one person, which the authors said "does not seem appropriate".
- Several did not state clearly what the target meant.
- Where many people could be harmed, societal risk should be considered, not only individual risk.
Write down your target, what consequence it applies to, who sets it and where it comes from, in the LOPA record itself.
LOPA vs HAZOP vs Bow-Tie vs Fault Tree
LOPA is one of several methods that look at the same scenarios from different angles. Chambers et al. (2024) note that bow-tie and LOPA "can be used in conjunction if applied correctly": the bow-tie gives a structured picture of threats and barriers, and LOPA puts numbers on one threat line at a time.
| Method | Question it answers | Type | Typical use |
|---|---|---|---|
| HAZOP | What deviations can happen, and what are their causes and consequences? | Qualitative | Finding scenarios in a detailed design |
| LOPA | Are the safeguards on this one scenario enough, and what SIL is needed? | Semi-quantitative | Testing the severe scenarios a HAZOP found |
| Bow-tie | What are all the threats and consequences of one top event, and what barriers sit on each path? | Qualitative, visual | Barrier management and communication |
| Fault tree | What combinations of failures lead to the top event, and how likely is it? | Quantitative | Complex scenarios with redundancy or shared causes, where LOPA's single-path view is too simple |
A good rule: if you cannot draw the scenario as one straight line from cause to consequence with independent layers in between, LOPA is the wrong tool and a fault tree is the right one. For a wider view of when numbers help and when they mislead, see quantitative vs qualitative risk assessment.
Common LOPA Mistakes
Most of the mistakes below come from the HSE-commissioned review of 15 real LOPA studies for fuel storage tank overfill (RR716, 2009). Its authors warn that LOPA "may appear to be an easy method to apply at first but this is deceptive".
1. Crediting layers that share a sensor, PLC or operator
The most common failure in RR716. If the alarm and the control loop use the same transmitter, or two alarms depend on the same operator, the layers fail together. The result is a frequency that is too low by a factor of ten or more, and a SIF specified one SIL too low, as the worked example shows.
2. Claiming a PFD below 0.1 for a non-SIL rated layer
Several studies gave ordinary instruments PFDs better than 0.1. Under BS EN 61511 that cannot be claimed, even if a reliability calculation gives a lower number.
3. Counting the initiating event as a layer
In one reviewed study, the automatic tank gauge appeared both as the cause of the overfill and as a protection layer. Check that no credited layer is part of the cause.
4. Shrinking the initiating event frequency
Breaking a cause into many small parts, each assumed independent, can make the total look much smaller than it is. Across the 15 reviewed studies, the summed initiating event frequencies differed by more than four orders of magnitude, although every study dealt with the same kind of event: a fuel storage tank overfill.
5. Unjustified or double-counted conditional modifiers
Probabilities of ignition, occupancy and fatality were often not justified and tended to be lower than expected. Low manning was sometimes used in two modifiers at once. Each modifier needs a reason written beside it.
6. Taking operator response for granted
Operator response is often given a PFD of 0.1 without any justification, and the valve the operator must close is often left out. Credit only a response that has an independent alarm, a written action, training and enough time.
7. No sensitivity check and no record of the data source
RR716 found a sensitivity study in only one study. Without one, a result can depend on a single guessed number. Name the data source for every value so that the next reviewer can check it.
How FindRisk Supports Process Risk Work
FindRisk does not run LOPA calculations, and a LOPA should not be done in a general-purpose app. Where it helps is in keeping the credited layers real once the study is signed off. A LOPA only holds if the independent alarm is tested, the shut-off valve is proof tested and nobody bypasses the SIF. FindRisk's AI can turn the IPL list from your LOPA into a field inspection checklist, so those checks happen on the plant and not only in the maintenance system.
During those rounds, you can photograph what you find, mark hazards on the photo (a new ignition source near the tank, a bypassed switch, a bund drain left open) and let the AI analysis point out what else is visible. Occupational hazards found on the same walk can be scored with the Fine-Kinney method, and the whole inspection becomes a professional report in seconds, on iOS and Android.
Frequently Asked Questions
What is the difference between HAZOP and LOPA?
HAZOP is a qualitative team study that finds deviations, their causes, consequences and safeguards across a whole design. LOPA takes one of those scenarios, usually one with a severe consequence, and estimates how often it will happen with the existing safeguards. HAZOP produces the list of scenarios; LOPA tells you whether the protection on the worst of them is enough and what SIL a new safety instrumented function needs.
Is LOPA qualitative or quantitative?
LOPA is semi-quantitative. It uses numbers for frequencies and probabilities, but each number is an order-of-magnitude estimate, often 0.1, 0.01 or 0.001, and the result is rounded. It sits between a risk matrix and a full quantitative risk assessment or fault tree. Its accuracy depends on the quality of the data, which is why the data source must be stated.
Can an operator response to an alarm be an independent protection layer?
Yes, if the alarm has its own sensor and does not depend on the failed control system, the operator has a written action, is trained and has enough time to act before the consequence. A non-SIL rated layer like this cannot be claimed with a PFD below 0.1. Two alarms answered by the same operator should be credited as one layer at most.
What is a conditional modifier in LOPA?
A conditional modifier is a probability that sits between the event and the harm being assessed, such as the probability of ignition, the probability that someone is in the affected area or the probability that exposure is fatal. It is not a safeguard. Each modifier must be justified and used once, so that, for example, low manning is not counted in two places.
What is the difference between a safeguard and an IPL?
A safeguard is anything listed as protection in a HAZOP. An independent protection layer is a safeguard that passes three tests: it is independent of the initiating event and of every other credited layer, it is effective enough to stop the scenario on its own, and its performance can be audited through testing. Training, procedures and alarms sharing a sensor with the cause are safeguards but not IPLs.
Is LOPA required by OSHA?
No. OSHA's Process Safety Management standard, 29 CFR 1910.119(e)(2), lists What-If, checklist, HAZOP, FMEA, fault tree analysis or an appropriate equivalent methodology for the process hazard analysis, and does not name LOPA. In practice LOPA is used alongside a HAZOP to judge whether safeguards are sufficient. Where SIL targets are needed, IEC 61508 and IEC 61511 point to LOPA or fault tree analysis for the more complex or higher hazards.
Who should take part in a LOPA?
A small team: a facilitator experienced in LOPA, a process engineer, an operations representative who knows how the plant really runs, an instrument or control engineer for the SIF and BPCS questions, and ideally someone from the original HAZOP. RR716 stresses that LOPA needs good knowledge of the plant in normal and emergency operation and experience in numerical safety studies.
Conclusion
LOPA turns a HAZOP's list of safeguards into a number you can compare with a target. The arithmetic is simple: initiating event frequency times conditional modifiers times the PFD of each independent protection layer. The hard part is honesty about which safeguards really count, which inputs you can defend and how much margin the result has.
In the worked example, the team listed four safeguards and could credit only one of them. Crediting an alarm that shared a transmitter with the cause would have set the new trip one SIL too low, and the sensitivity check showed the planned design had almost no margin. Those are the checks that make a LOPA worth doing.
Download FindRisk to turn the protection layers from your LOPA into field checklists, so the layers you credited are still in place every time someone walks the plant.
Try FindRisk
Ready to modernize your safety workflow?
Conduct AI-powered risk assessments, generate reports instantly, and keep your team safe — anywhere, anytime.